Information Design & Data Viz

80 videos · Data visualization · Explorable explanations & visual explanation · Maps & cartography

The Beauty of Bézier Curves24:26

The Beauty of Bézier Curves

Freya Holmér
2.2M views • 5 years ago
A Better Default Colormap for Matplotlib | SciPy 2015 | Nathaniel Smith and Stéfan van der Walt19:09

A Better Default Colormap for Matplotlib | SciPy 2015 | Nathaniel Smith and Stéfan van der Walt

Enthought
178K views • 11 years ago
Hans Rosling's 200 Countries, 200 Years, 4 Minutes - The Joy of Stats - BBC4:48

Hans Rosling's 200 Countries, 200 Years, 4 Minutes - The Joy of Stats - BBC

BBC
11.5M views • 15 years ago
The Continuity of Splines1:13:50

The Continuity of Splines

Freya Holmér
1.9M views • 3 years ago
DNA animation (2002-2014) by Drew Berry and Etsuko Uno wehi.tv #ScienceArt7:20

DNA animation (2002-2014) by Drew Berry and Etsuko Uno wehi.tv #ScienceArt

WEHImovies
7.3M views • 8 years ago
A Time-Lapse Map of Every Nuclear Explosion Since 1945 - by  Isao Hashimoto14:25

A Time-Lapse Map of Every Nuclear Explosion Since 1945 - by Isao Hashimoto

aConcernedHuman
15.8M views • 16 years ago
Powers of Ten™ (1977)9:01

Powers of Ten™ (1977)

Eames Office
9.5M views • 16 years ago
The best stats you've ever seen | Hans Rosling20:36

The best stats you've ever seen | Hans Rosling

TED
4.4M views • 19 years ago
4 2 1 Christopher Domas   The future of RE Dynamic Binary Visualization48:39

4 2 1 Christopher Domas The future of RE Dynamic Binary Visualization

Adrian Crenshaw
59K views • 14 years ago
A4 Paper Is Too Perfect8:44

A4 Paper Is Too Perfect

CGP Grey
10.5M views • 5 years ago
The Known Universe by AMNH #datavisualization6:31

The Known Universe by AMNH #datavisualization

American Museum of Natural History
17.3M views • 16 years ago
Gall--Peters Projection4:00

Gall--Peters Projection

UsefulClips
2.5M views • 16 years ago
Animations of unseeable biology | Drew Berry | TED9:09

Animations of unseeable biology | Drew Berry | TED

TED
2.7M views • 14 years ago
Interactive notebooks ~ Pluto.jl | Fons van der Plas | JuliaCon 202023:38

Interactive notebooks ~ Pluto.jl | Fons van der Plas | JuliaCon 2020

The Julia Programming Language
48K views • 6 years ago
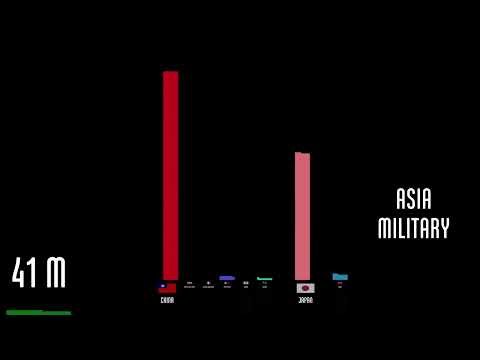
Making things with maths - Steven Wittens53:45

Making things with maths - Steven Wittens
webdirections
55K views • 13 years ago
The Fallen of World War II18:31

The Fallen of World War II

Neil Halloran
15.1M views • 10 years ago
I made maps that show time instead of space10:44

I made maps that show time instead of space

Václav Volhejn
2.2M views • 2 years ago
[JSConfUS 2013] Steven Wittens: Making WebGL Dance30:55

[JSConfUS 2013] Steven Wittens: Making WebGL Dance

JSConf
56K views • 13 years ago
How I animate 3Blue1Brown | A Manim demo with Ben Sparks53:41

How I animate 3Blue1Brown | A Manim demo with Ben Sparks

3Blue1Brown
3.3M views • 2 years ago
4D Toys: a box of four-dimensional toys, and how objects bounce and roll in 4D5:29

4D Toys: a box of four-dimensional toys, and how objects bounce and roll in 4D

[mtbdesignworks {Miegakure, 4D Toys}]
5.9M views • 9 years ago
Molecular Visualizations of DNA (2003) Drew Berry wehi.tv3:06

Molecular Visualizations of DNA (2003) Drew Berry wehi.tv

WEHImovies
1.2M views • 15 years ago
Why all world maps are wrong6:00

Why all world maps are wrong

Vox
23.8M views • 9 years ago
To Scale: THE SOLAR SYSTEM7:07

To Scale: THE SOLAR SYSTEM

To Scale:
16.5M views • 11 years ago
Quaternions and 3d rotation, explained interactively5:59

Quaternions and 3d rotation, explained interactively
3Blue1Brown
1.6M views • 8 years ago
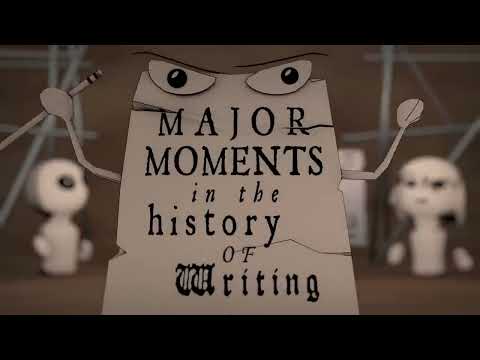
Thoth's Pill - an Animated History of Writing47:25

Thoth's Pill - an Animated History of Writing

NativLang
1.3M views • 10 years ago
Apoptosis *WATERMARK* (2006)  by Drew Berry wehi.tv, sound design Franc Tétaz4:39

Apoptosis *WATERMARK* (2006) by Drew Berry wehi.tv, sound design Franc Tétaz

WEHImovies
686K views • 17 years ago
༄ GRAVITY BASINS ࿐6:15

༄ GRAVITY BASINS ࿐

2swap
959K views • 2 years ago
Bret Victor - Drawing Dynamic Visualizations35:16

Bret Victor - Drawing Dynamic Visualizations

Colin McDonnell
17K views • 11 years ago
violin plots should not exist42:15

violin plots should not exist

Angela Collier
289K views • 3 years ago
NEW CELLULAR AUTOMATA12:28

NEW CELLULAR AUTOMATA

TodePond
138K views • 4 years ago
How Humans See Data - John Rauser - Velocity Amsterdam 201641:21

How Humans See Data - John Rauser - Velocity Amsterdam 2016

John Rauser
29K views • 9 years ago
How to walk through walls using the 4th Dimension [Miegakure: a 4D game]3:32

How to walk through walls using the 4th Dimension [Miegakure: a 4D game]

[mtbdesignworks {Miegakure, 4D Toys}]
2.2M views • 12 years ago
Hans Rosling: Global population growth, box by box10:16

Hans Rosling: Global population growth, box by box

TED
1.9M views • 16 years ago
Bret Victor - Media for Thinking the Unthinkable39:33

Bret Victor - Media for Thinking the Unthinkable

Colin McDonnell
33K views • 11 years ago
[Nerdy] Sorting Out Sorting30:57

[Nerdy] Sorting Out Sorting

BachMacintosh
81K views • 14 years ago
REcon 2013 - The Future of RE : Dynamic Binary Visualization (Christopher Domas)1:03:22

REcon 2013 - The Future of RE : Dynamic Binary Visualization (Christopher Domas)

Sébastien Duquette
9K views • 12 years ago
"Computational Physics, Beyond the Glass" by Sam Ritchie (Strange Loop 2023)39:11

"Computational Physics, Beyond the Glass" by Sam Ritchie (Strange Loop 2023)

Strange Loop Conference
9K views • 3 years ago
I Made a Graph of Wikipedia... This Is What I Found19:44

I Made a Graph of Wikipedia... This Is What I Found

adumb
4.4M views • 2 years ago
Why do maps show places that don't exist?6:00

Why do maps show places that don't exist?

Map Men
3.7M views • 7 years ago
Google Maps Hacks by Simon Weckert1:43

Google Maps Hacks by Simon Weckert

Simon Weckert
3.6M views • 6 years ago
Globe Making: How the World is Made (1955) | British Pathé2:41

Globe Making: How the World is Made (1955) | British Pathé

British Pathé
6M views • 12 years ago
What Makes People Engage With Math | Grant Sanderson | TEDxBerkeley19:02

What Makes People Engage With Math | Grant Sanderson | TEDxBerkeley

TEDx Talks
1.6M views • 6 years ago
How I make science animations43:39

How I make science animations

Artem Kirsanov
941K views • 3 years ago
Illuminating hyperbolic geometry4:26

Illuminating hyperbolic geometry

Henry Segerman
266K views • 10 years ago
The New York City Evolution Animation8:58

The New York City Evolution Animation

Myles Zhang
5.2M views • 8 years ago
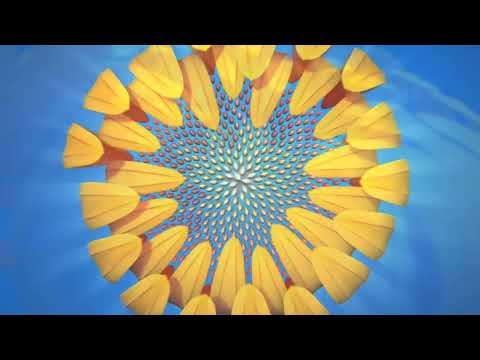
Max Cooper - Aleph 2 (Official Video by Martin Krzywinski)6:35

Max Cooper - Aleph 2 (Official Video by Martin Krzywinski)
Max Cooper
309K views • 7 years ago
Nature by Numbers3:44

Nature by Numbers

Cristóbal Vila / Etérea Estudios
6.6M views • 16 years ago
Hans Rosling: Debunking third-world myths with the best stats you've ever seen20:36

Hans Rosling: Debunking third-world myths with the best stats you've ever seen

TED
2.2M views • 19 years ago
If Rockets were Transparent9:13

If Rockets were Transparent

Hazegrayart
8.8M views • 6 years ago
Graphical quadratic formula solver from 1915 (nomogram)8:16

Graphical quadratic formula solver from 1915 (nomogram)

Chris Staecker
26K views • 4 years ago
Map Making (1961)3:36

Map Making (1961)

British Pathé
2.3M views • 12 years ago
Shut up about the y-axis. It shouldn’t always start at zero.2:34

Shut up about the y-axis. It shouldn’t always start at zero.

Vox
1M views • 10 years ago
The Tube Map nearly looked very different11:24

The Tube Map nearly looked very different

Map Men
2.6M views • 4 years ago
Exploring Large Tables with Table Lens - 1994 - Ramana Rao & Stuart Card9:32

Exploring Large Tables with Table Lens - 1994 - Ramana Rao & Stuart Card

Ramana Rao
2K views • 9 years ago
Designing Math ft. Grant Sanderson (3Blue1Brown) I Config 202627:29

Designing Math ft. Grant Sanderson (3Blue1Brown) I Config 2026

Figma
341K views • 4 months ago
Why are we changing maps?  (from The West Wing)3:58

Why are we changing maps? (from The West Wing)

SaltLakeUsersGroup
800K views • 14 years ago
iPhone Resolution by Edward Tufte5:45

iPhone Resolution by Edward Tufte

Edward Tufte
53K views • 17 years ago
How coronavirus charts can mislead us4:58

How coronavirus charts can mislead us

Vox
2.6M views • 6 years ago
Vega Lite: A Grammar of Interactive Graphics - Wongsuphasawat, Moritz, and Satyanarayan30:07

Vega Lite: A Grammar of Interactive Graphics - Wongsuphasawat, Moritz, and Satyanarayan

BocoupLLC
35K views • 9 years ago
The Crisis of Credit Visualized - Part 17:32

The Crisis of Credit Visualized - Part 1

graphixmdp
1.4M views • 17 years ago
Mike Bostock - Design is a Search Problem42:42

Mike Bostock - Design is a Search Problem

BocoupLLC
51K views • 12 years ago
I Tried Creating a Game Using Real-World Geographic Data31:37

I Tried Creating a Game Using Real-World Geographic Data

Sebastian Lague
6.1M views • 4 years ago
This is Music On An Oscilloscope - (Drawing with Sound) - Smarter Every Day 22417:00

This is Music On An Oscilloscope - (Drawing with Sound) - Smarter Every Day 224

SmarterEveryDay
2.3M views • 7 years ago
CD / Blur9:43

CD / Blur

Captain Disillusion
1.4M views • 1 year ago
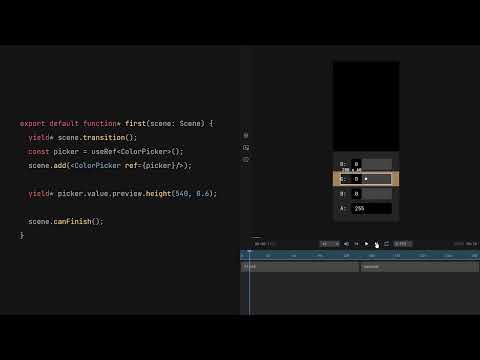
Animating with Code - Motion Canvas6:58

Animating with Code - Motion Canvas

aarthificial
253K views • 4 years ago
Twitter in Plain English2:25

Twitter in Plain English

Common Craft Explainer Videos
3.1M views • 18 years ago
"Mapping Imaginary Cities" by Mouse Reeve40:57

"Mapping Imaginary Cities" by Mouse Reeve

Strange Loop Conference
7K views • 8 years ago
Logstalgia - Website Access Log Visualization1:15

Logstalgia - Website Access Log Visualization

Logstalgia
445K views • 16 years ago
3D Visualizer with Oculus and Hydra14:20

3D Visualizer with Oculus and Hydra

okreylos
10K views • 13 years ago
Etak Navigator Tour & Demo31:35

Etak Navigator Tour & Demo

EllsworthC
19K views • 10 years ago
Hans Rosling: The River of Myths2:51

Hans Rosling: The River of Myths

Bill Gates
192K views • 13 years ago
The map that saved the most lives8:08

The map that saved the most lives

Map Men
2.6M views • 5 years ago
Google I/O 2013 - Project Ground Truth: Accurate Maps Via Algorithms and Elbow Grease40:21

Google I/O 2013 - Project Ground Truth: Accurate Maps Via Algorithms and Elbow Grease

Google for Developers
66K views • 13 years ago
Non-euclidean virtual reality12:11

Non-euclidean virtual reality

Henry Segerman
982K views • 9 years ago
See how the rest of the world lives, organized by income | Anna Rosling Rönnlund11:42

See how the rest of the world lives, organized by income | Anna Rosling Rönnlund
TED
881K views • 8 years ago
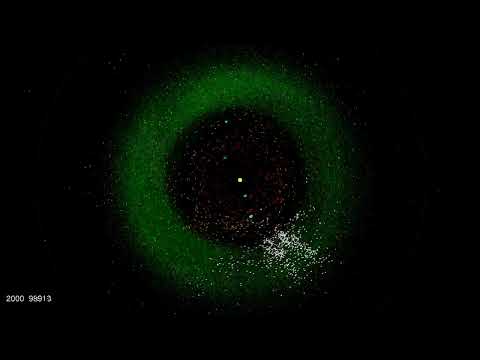
Asteroid Discovery - 1980-2012 - UHDTV3:14

Asteroid Discovery - 1980-2012 - UHDTV

Scott Manley
231K views • 14 years ago
The Datasaurus Dozen8:18

The Datasaurus Dozen

Stand-up Maths
137K views • 6 years ago
The History and Future of Everything -- Time7:10

The History and Future of Everything -- Time

Kurzgesagt – In a Nutshell
7.5M views • 12 years ago
Why Every Map of China is Just Slightly Wrong5:42

Why Every Map of China is Just Slightly Wrong

Half as Interesting
4M views • 7 years ago
Sonification & The Problem with Making Music from Data14:48

Sonification & The Problem with Making Music from Data

Tantacrul
259K views • 9 years ago